Know Exactly What Your Team Is Working On
eWorkPulse silently monitors application usage, captures compliance screenshots, and delivers real-time productivity analytics — giving you proof of work without micromanaging.
Every tool your operations team needs
Built for HR, IT, and operations managers who need real, verifiable data — not self-reported timesheets.
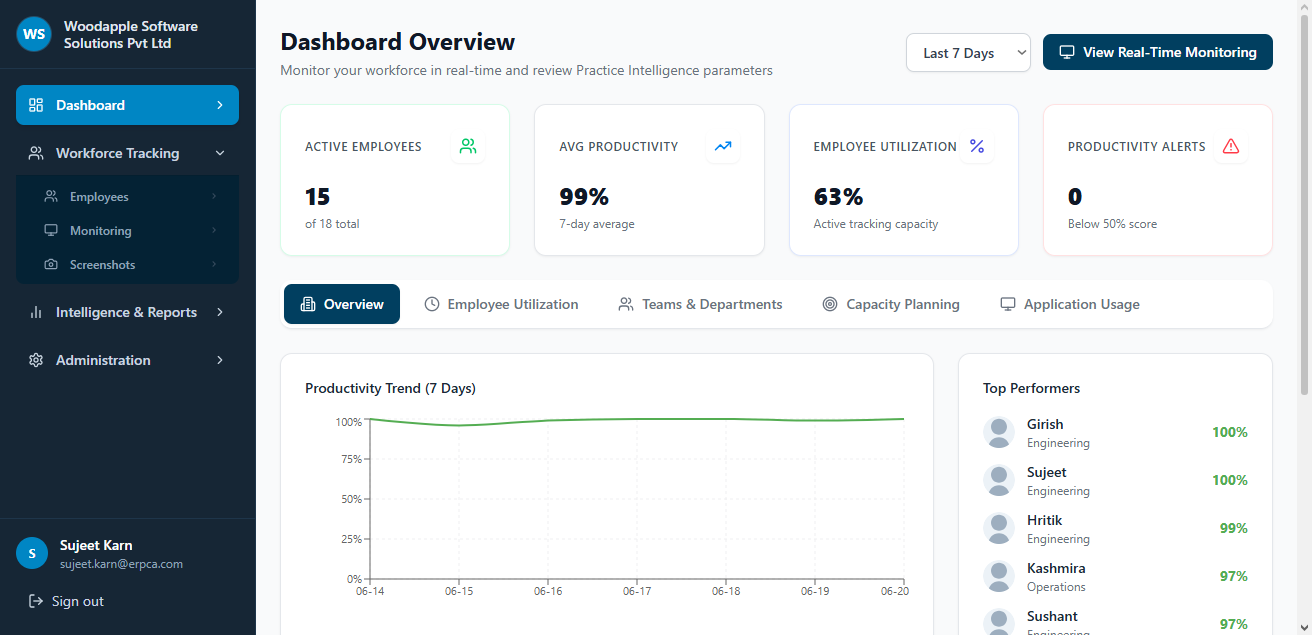
Real-Time Dashboard
Monitor active, idle, and offline employees from a single view. Filter by team, department, or individual. See live productivity scores updated every sync cycle.
→ Live KPI Cards · Trend ChartsActivity & Time Tracking
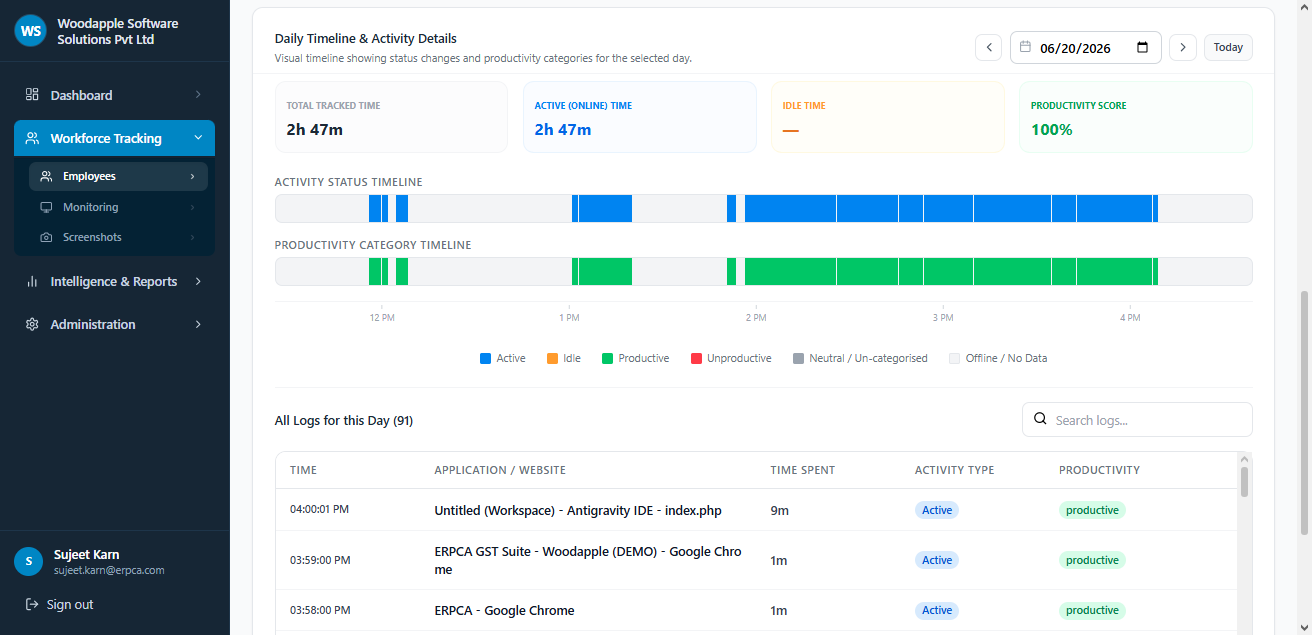
The desktop agent logs every application focus change and idle period automatically. Daily timeline bars show exactly when an employee was active, idle, or offline — timestamped to the second.
→ Activity Timelines · Daily StatsApp & Website Categorization
All applications and websites are classified as Productive, Neutral, or Unproductive. Admins can override classifications for any app in real-time. Hours are summed per category automatically.
→ App Usage Reports · Policy EngineCompliance Screenshots
Automated screenshots are captured at configurable intervals and tagged with productivity classification. Admins can filter by employee, department, and date — with a fullscreen lightbox viewer.
→ Screenshot Grid · Date FiltersPolicy Management
Define custom productivity policies by app name or website domain. Assign rules per department or organization-wide. Policies are enforced automatically by the agent on every workstation.
→ App Policies · Website RulesReports Engine
Generate Productivity, Department Summary, App Usage, Attendance, and full Audit Trail reports across any date range. Export to Excel in one click with full granular data.
→ 5 Report Types · XLSX ExportWatch the Tracking Agent in Action
The lightweight eWorkPulse desktop agent runs silently in the background. It detects every application focus change, classifies activity in real-time, and syncs data to your cloud dashboard — without slowing down the workstation.
- Auto-starts on system boot — no user interaction needed
- Classifies every app as Productive, Neutral, or Unproductive
- Smart idle detection — pauses tracking when no keyboard/mouse input
- Captures compliance screenshots at admin-defined intervals
- Syncs data to cloud dashboard every few minutes
Features · Advantages · Benefits
Understand exactly what eWorkPulse delivers at every level — from the technical capability to the business outcome it creates for your organization.
Automatic Time & Activity Logging
The agent detects keyboard/mouse activity and application focus changes. Active and idle periods are logged minute-by-minute and stored with full timestamps. No manual timesheets.
Application & Website Monitoring
Every application and browser URL opened on the workstation is captured. Usage is aggregated by hours per app, per user, and per day — filterable across your entire organization.
Compliance Screenshot Capture
Screenshots taken automatically at admin-configured intervals. Stored securely in the cloud with timestamps, employee names, and department tags. Filter by date, employee, or department.
Productivity Policy Engine
Admins define policies that classify apps and websites as Productive, Neutral, or Unproductive. Rules can be scoped per department or org-wide. The agent enforces these rules live on every device.
5-Type Reports Engine
Generate Productivity & Time, Department Summary, App Usage, Attendance & Active Ratio, and Activity Audit Trail reports. Export any report to Excel with full granular data.
Practice Intelligence & Capacity Planning
Utilization rates calculated per employee. Identifies Over-utilized employees (burnout risk) and Under-utilized bench strength ready for new project allocation.
Ultra-Lightweight Agent
The background agent uses minimal CPU and RAM resources. Employees never notice it running — no slowdowns, no intrusive pop-ups, no interruptions to their workflow.
Instant App Re-Classification
From the employee detail page, admins can change an application's productivity category with a single dropdown. The change is applied retroactively across all analytics.
Daily Visual Timeline
A pixel-perfect timeline bar shows the exact second-by-second status of each employee — Active (blue), Idle (amber), Productive (green), Unproductive (red) — for any selected date.
System Information Monitoring
Beyond time tracking, the agent reports hardware specs (CPU, RAM, OS, drives), connected USB devices, installed applications, and OS update status — all from one dashboard.
Multi-Organization Architecture
Super admins can manage multiple client organizations from one unified console. Each org has isolated data, separate billing, and independent admin access controls.
Searchable Audit Trail
Every application access, URL visited, and duration is stored as an immutable audit log. Filter, search, and export the full activity trail for any employee or department.
Eliminate Unverifiable Timesheets
Replace self-reported hours with system-verified timestamps and app usage logs. Your billing data and project hour records are now 100% accurate and auditable.
Identify Burnout Before It Happens
Capacity Planning automatically flags employees logging over 100% utilization. Managers can intervene, redistribute work, and prevent costly team attrition.
Reclaim Hidden Productive Hours
Application-wise usage reports reveal exactly how much time is spent on non-work tools. Organizations using eWorkPulse typically identify 8–15% recoverable working hours per month.
Replace Daily Status Meetings
Managers see real-time activity, active app, and productivity score for every team member. Zero need for "what are you working on?" check-ins — data replaces supervision.
Compliance-Ready Screenshot Audit
For regulated industries or client-facing service firms, periodic screenshot capture creates a timestamped visual evidence trail of workforce compliance and professional conduct.
Optimize Resource Allocation
Under-utilized bench strength is identified automatically. Operations leads can instantly assign available capacity to incoming projects without guessing or conducting time-consuming skills assessments.
Trusted by operations leaders
"We replaced all our manual timesheets with eWorkPulse. Our billing accuracy went from ~80% to 97% in the first month because we now have actual logged hours, not memory-based entries."
"The capacity planning dashboard is a revelation. We immediately saw 4 developers at 120%+ utilization while 3 others had available bandwidth. We reshuffled within hours."
"As an IT manager, the system info monitoring module alone is worth it. I can see every installed application, USB devices, and OS update status for all 80 endpoints from one screen."
Ready to transform how you manage your workforce?
Join 200+ organizations using eWorkPulse to build transparent, data-driven remote work cultures.